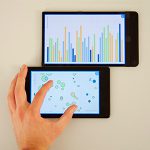
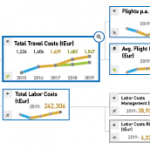
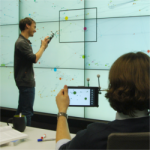
GEMS 2.0 ist eine Nachfolgeprojekt des GEMS – Graph Exploration and Manipulation on interactive Surfaces Projektes, welches von November 2012 bis Februar 2016 lief. Wie das Vorgängerprojekt ist GEMS 2.0 eine Kooperation zwischen dem Lehrstuhl Multimedia-Technologie (IML) der Technischen Universität Dresden und dem Lehrstuhl Computergraphik (VC²G) der Universität Rostock.
Graphen werden universell in vielen verschiedenen Anwendungsgebieten eingesetzt. Hierzu zählen Kommunikation, Transportwesen, Biologie oder auch Klimatologie. Oft sind in heutigen Anwendungen nicht nur die Knoten und Kanten der Graphen von Interesse, d.h. die Graphstruktur, sondern auch mit den Knoten und Kanten assoziierte Datenattribute. Die Arbeit mit derartigen multivariaten Graphen mit ihrem komplexen Zusammenspiel von Struktur und Datenattributen stellt eine besondere Herausforderung dar.
Die Arbeit mit Daten wird häufig als Datenanalyse verstanden. Interaktive Visualisierung hat sich als geeignetes Mittel herausgestellt, vielfältige Analyseaufgaben zu unterstützen. Jedoch beinhaltet das Arbeiten mit Graphen heute mehr als nur das Verstehen einfacher Zusammenhänge in den Daten. Vielmehr ist es notwendig, eine ganze Reihe von Aktivitäten in Hinblick auf die Graphanalyse zu berücksichtigen. Daher soll in diesem Projekt die klassische Datenexploration so erweitert werden, dass zusätzlich vergleichende Analysen mehrerer Graphen sowie das direkte Editieren von Knoten, Kanten und Datenattributen möglich sind.
Zugehörige Publikationen
Im Rahmen von GEMS 2.0 sind bis jetzt folgende Publikationen am Interactive Media Lab entstanden:
@inbook{horak2021,
author = {Tom Horak and Wolfgang Aigner and Matthew Brehmer and Alark Joshi and Christian Tominski},
editor = {Bongshin Lee and Raimund Dachselt and Petra Isenberg and Eun Kyoung Choe},
title = {Responsive Visualization Design for Mobile Devices},
booktitle = {Mobile Data Visualization},
year = {2021},
pages = {33--66},
doi = {10.1201/9781003090823-2},
publisher = {Chapman and Hall/CRC}
}Weitere Materialien
@inproceedings{Horak2020MultivariateNetworksMobile,
author = {Tom Horak and Ricardo Langner and Raimund Dachselt},
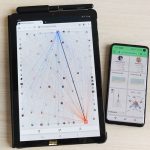
title = {Towards Visualizing and Exploring Multivariate Networks on Mobile Devices},
booktitle = {Companion Proceedings of the 2020 Conference on Interactive Surfaces and Spaces},
series = {ISS '20 Companion},
year = {2020},
month = {11},
location = {Virtual Event, Portugal},
pages = {5--8},
doi = {10.1145/3380867.3426201},
publisher = {ACM},
address = {New York, NY, USA}
}Weitere Materialien
@article{Horak2020ResponsiveMatrixCells,
author = {Tom Horak and Philip Berger and Heidrun Schumann and Raimund Dachselt and Christian Tominski},
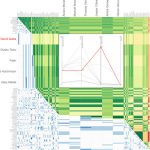
title = {Responsive Matrix Cells: A Focus+Context Approach for Exploring and Editing Multivariate Graphs},
journal = {IEEE Transactions on Visualization and Computer Graphics},
issue = {27},
number = {2},
year = {2021},
month = {2},
location = {Salt Lake City, UT, USA},
pages = {1644--1654},
doi = {10.1109/TVCG.2020.3030371},
publisher = {IEEE}
}Weitere Materialien
, Video, Online Demo
@inproceedings{Klamka2020,
author = {Konstantin Klamka and Tom Horak and Raimund Dachselt},
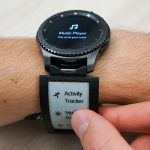
title = {Watch+Strap: Extending Smartwatches with Interactive StrapDisplays},
booktitle = {Proceedings of the CHI Conference on Human Factors in Computing Systems},
year = {2020},
month = {4},
location = {Honolulu, Hawaii, USA},
pages = {72:1--72:15},
doi = {10.1145/3313831.3376199},
publisher = {ACM}
}Weitere Materialien
, Video
@article{Mathisen:2019,
author = {Andreas Mathisen and Tom Horak and Clemens N. Klokmose and Kaj Grønbæk and Niklas Elmqvist},
title = {InsideInsights: Integrating Data-Driven Reporting in Collaborative Visual Analytics},
journal = {Computer Graphics Forum},
volume = {38},
issue = {3},
year = {2019},
month = {6},
location = {Porto, Portugal},
pages = {649--661},
doi = {10.1111/cgf.13717},
publisher = {Wiley Online Library}
}Weitere Materialien
@inproceedings{Horak2019,
author = {Tom Horak and Andreas Mathisen and Clemens N. Klokmose and Raimund Dachselt and Niklas Elmqvist},
title = {Vistribute: Distributing Interactive Visualizations in Dynamic Multi-Device Setups},
booktitle = {Proceedings of the CHI Conference on Human Factors in Computing Systems},
year = {2019},
month = {5},
location = {Glasgow, Scotland, UK},
pages = {616:--616:13},
doi = {10.1145/3290605.3300846},
publisher = {ACM}
}Weitere Materialien
, Video
@inproceedings{fixme,
author = {Tom Horak},
title = {Designing for Visual Data Exploration in Multi-Device Environments},
booktitle = {Extended Abstracts of the CHI Conference on Human Factors in Computing Systems},
year = {2019},
month = {5},
location = {Glasgow, UK, Scotland},
pages = {DC11:1--DC11:6},
doi = {10.1145/3290607.3299086},
publisher = {ACM},
address = {New York, NY, USA}
}Weitere Materialien
@inproceedings{fixme,
author = {Tom Horak and Ulrike Kister and Raimund Dachselt},
title = {Comparing Rendering Performance of Common Web Technologies for Large Graphs},
booktitle = {Poster Program of the 2018 IEEE VIS Conference},
year = {2018},
month = {10},
location = {Berlin, Germany},
numpages = {2}
}@inproceedings{fixme,
author = {Javid Abbasov and Tom Horak and Raimund Dachselt},
title = {Smartwatch-based Pointing Interaction},
booktitle = {Mensch und Computer 2018 - Tagungsband},
year = {2018},
month = {9},
location = {Dresden, Germany},
pages = {261--265},
doi = {10.18420/muc2018-mci-0373},
publisher = {Gesellschaft f\"{u}r Informatik e.V.}
}Weitere Materialien
@inproceedings{fixme,
author = {Ricardo Langner and Tom Horak and Raimund Dachselt},
title = {Demonstrating VisTiles: Visual Data Exploration Using Mobile Devices},
booktitle = {Proceedings of the 2018 International Conference on Advanced Visual Interfaces},
series = {AVI '18},
year = {2018},
month = {5},
isbn = {978-1-4503-5616-9},
location = {Castiglione della Pescaia, Grosseto, Italy},
pages = {69:1--69:3},
numpages = {3},
doi = {10.1145/3206505.3206583},
url = {http://doi.org/10.1145/3206505.3206583},
acmid = {3206583},
publisher = {ACM},
address = {New York, NY, USA}
}Weitere Materialien
@inproceedings{Horak2018,
author = {Tom Horak and Sriram Karthik Badam and Niklas Elmqvist and Raimund Dachselt},
title = {When David Meets Goliath: Combining Smartwatches with a Large Vertical Display for Visual Data Exploration},
booktitle = {Proceedings of the CHI Conference on Human Factors in Computing Systems},
year = {2018},
month = {4},
location = {Montreal, QC, Canada},
pages = {19:1--19:13},
doi = {10.1145/3173574.3173593},
url = {https://doi.org/10.1145/3173574.3173593},
publisher = {ACM}
}Weitere Materialien
, Video
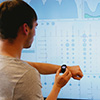
Demonstrating David Meets Goliath: Combining Smartwatches with a Large Vertical Display for Visual Data Exploration
@inproceedings{Horak2018a,
author = {Tom Horak and Sriram Karthik Badam and Niklas Elmqvist and Raimund Dachselt},
title = {Demonstrating David Meets Goliath: Combining Smartwatches with a Large Vertical Display for Visual Data Exploration},
booktitle = {Extended Abstracts of the CHI Conference on Human Factors in Computing Systems},
series = {CHI EA '18},
year = {2018},
month = {4},
location = {Montreal, QC, Canada},
pages = {D414:1--D414:4},
doi = {10.1145/3170427.3186497},
url = {https://doi.org/10.1145/3170427.3186497},
publisher = {ACM}
}Weitere Materialien
, Video
@inproceedings{Horak2018b,
author = {Tom Horak and Raimund Dachselt},
title = {Hierarchical Graphs on Mobile Devices: A Lane-based Approach},
booktitle = {Proceedings of the CHI 2018 Workshop on Data Visualization on Mobile Devices},
series = {MobileVis '18},
year = {2018},
month = {4},
location = {Montreal, QC, Canada},
numpages = {7}
}Weitere Materialien
@article{Langner:2018aa,
author = {Ricardo Langner and Tom Horak and Raimund Dachselt},
title = {VisTiles: Coordinating and Combining Co-located Mobile Devices for Visual Data Exploration},
journal = {IEEE Transactions on Visualization and Computer Graphics},
volume = {24},
issue = {1},
year = {2018},
month = {1},
location = {Phoenix, Arizona USA},
pages = {626--636},
numpages = {11},
doi = {10.1109/TVCG.2017.2744019},
url = {http://dx.doi.org/10.1109/TVCG.2017.2744019},
publisher = {IEEE},
keywords = {collaboration, data visualization, mobile communication, prototypes, smart phones, visualization, mobile devices, coordinated \& multiple views, cross-device interaction, multi-display environment}
}Weitere Materialien
, Video
@inproceedings{fixme,
author = {Tom Horak and Ulrike Kister and Raimund Dachselt},
title = {Improving Value Driver Trees to Enhance Business Data Analysis},
booktitle = {Poster Program of the 2017 IEEE VIS Conference},
year = {2017},
month = {10},
location = {Phoenix, Arizona, USA},
numpages = {2}
}@article{Kister2017_grasp,
author = {Ulrike Kister and Konstantin Klamka and Christian Tominski and Raimund Dachselt},
title = {GraSp: Combining Spatially-aware Mobile Devices and a Display Wall for Graph Visualization and Interaction},
journal = {Computer Graphics Forum},
volume = {36},
number = {3},
year = {2017},
month = {6},
isbn = {1467-8659},
pages = {503--514},
numpages = {9},
doi = {10.1111/cgf.13206},
url = {https://doi.org/10.1111/cgf.13206}
}Weitere Materialien
Zugehörige Abschlussarbeiten
Im Rahmen von GEMS 2.0 sind folgende studentische Arbeiten am Interactive Media Lab entstanden:
Responsive Graphs: Anpassung von Node-Link Diagrammen für Mobilgeräte
Tobias Knothe 19. Juni 2020 bis 20. November 2020
Betreuung: Tom Horak, Eva Goebel, Raimund Dachselt

Strategien zur Anpassung von Visualisierungen in Dashboards für die Nutzung auf Mobilgeräten
Lars Arne Beck 24. Mai 2019 bis 8. Dezember 2019
Betreuung: Tom Horak, Tamara Flemisch, Raimund Dachselt

Visuelle Datenexploration von Graphen mit geräteübergreifenden Workflows zwischen einem großen Display und Mobilgeräten
Elisabeth Baudisch 23. Februar 2018 bis 22. September 2018
Betreuung: Tom Horak, Ricardo Langner, Raimund Dachselt

Pointing Interaction with Mobile Devices Using Internal Sensors
Javid Abbasov 2. Oktober 2017 bis 12. März 2018
Betreuung: Tom Horak, Raimund Dachselt

Neuartige Ansätze zur Visualisierung und Interaktion mit Daten auf Smartwatches
Anselm Bunsen 7. Juni 2019 bis 23. August 2019
Betreuung: Tom Horak, Konstantin Klamka, Raimund Dachselt

Semi-automatische Bearbeitung von Elementen und Layout multivariater Graphvisualisierungen
Antonio Pietzsch 15. Dezember 2017 bis 2. März 2018
Betreuung: Tom Horak, Ulrike Kister, Raimund Dachselt

Performanceanalyse und –optimierung von Web-basierten multivariaten Graphvisualisierungen
Robin Thomas 24. November 2017 bis 9. Februar 2018
Betreuung: Tom Horak, Ulrike Kister, Raimund Dachselt

Eingebettete Mikro-Visualisierungen in interaktiven Matrix-Visualisierungen von multivariaten Graphen
Paul Hoffmann 24. Mai 2019 bis 11. Oktober 2019
Betreuung: Tom Horak, Raimund Dachselt

