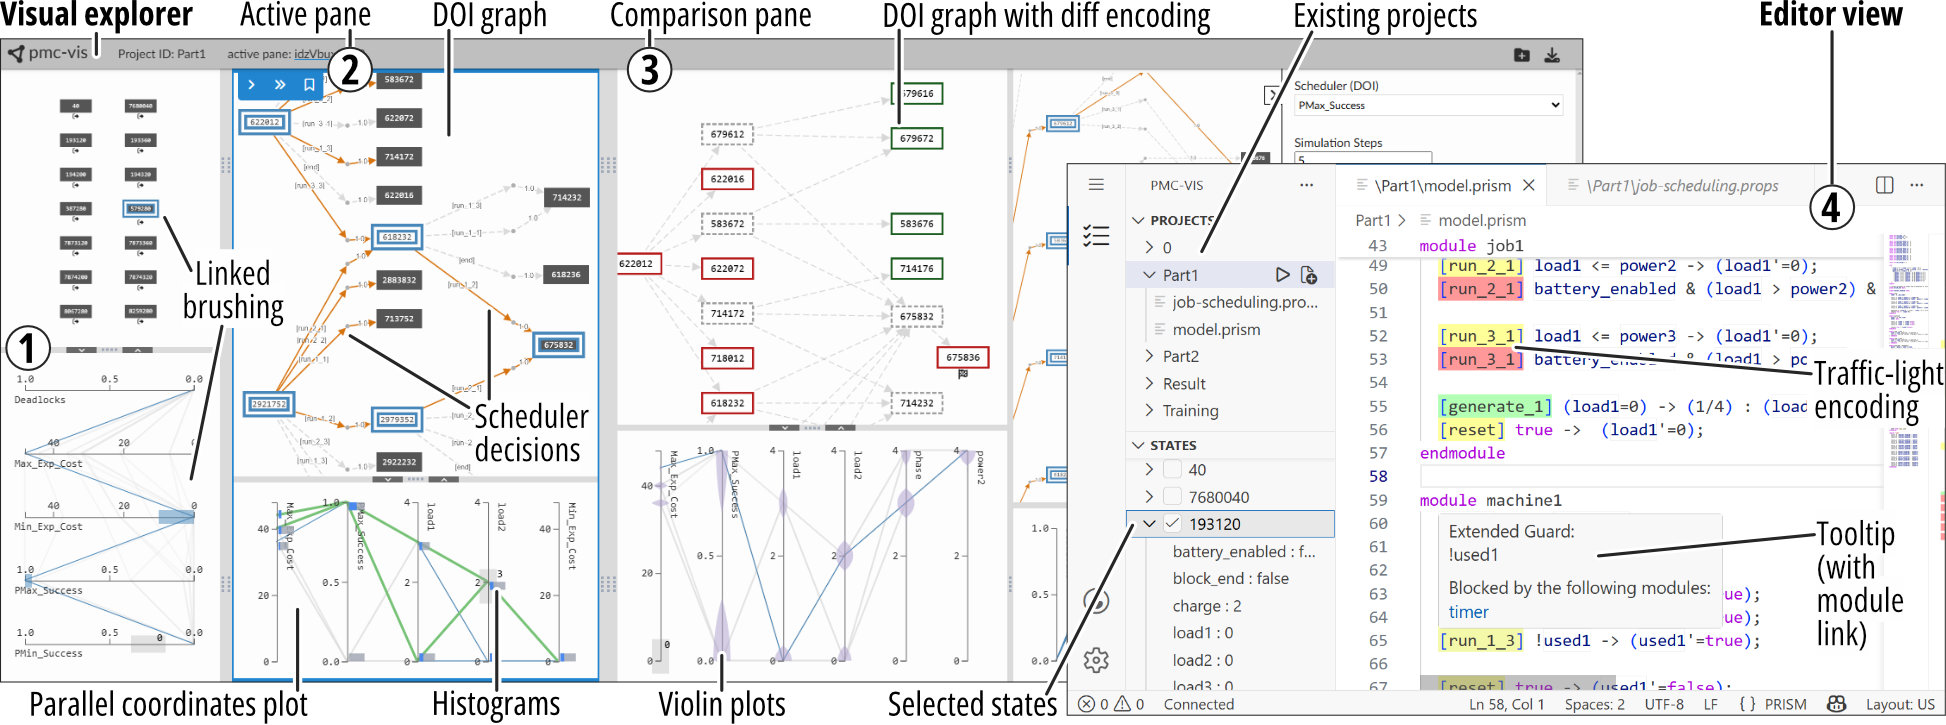
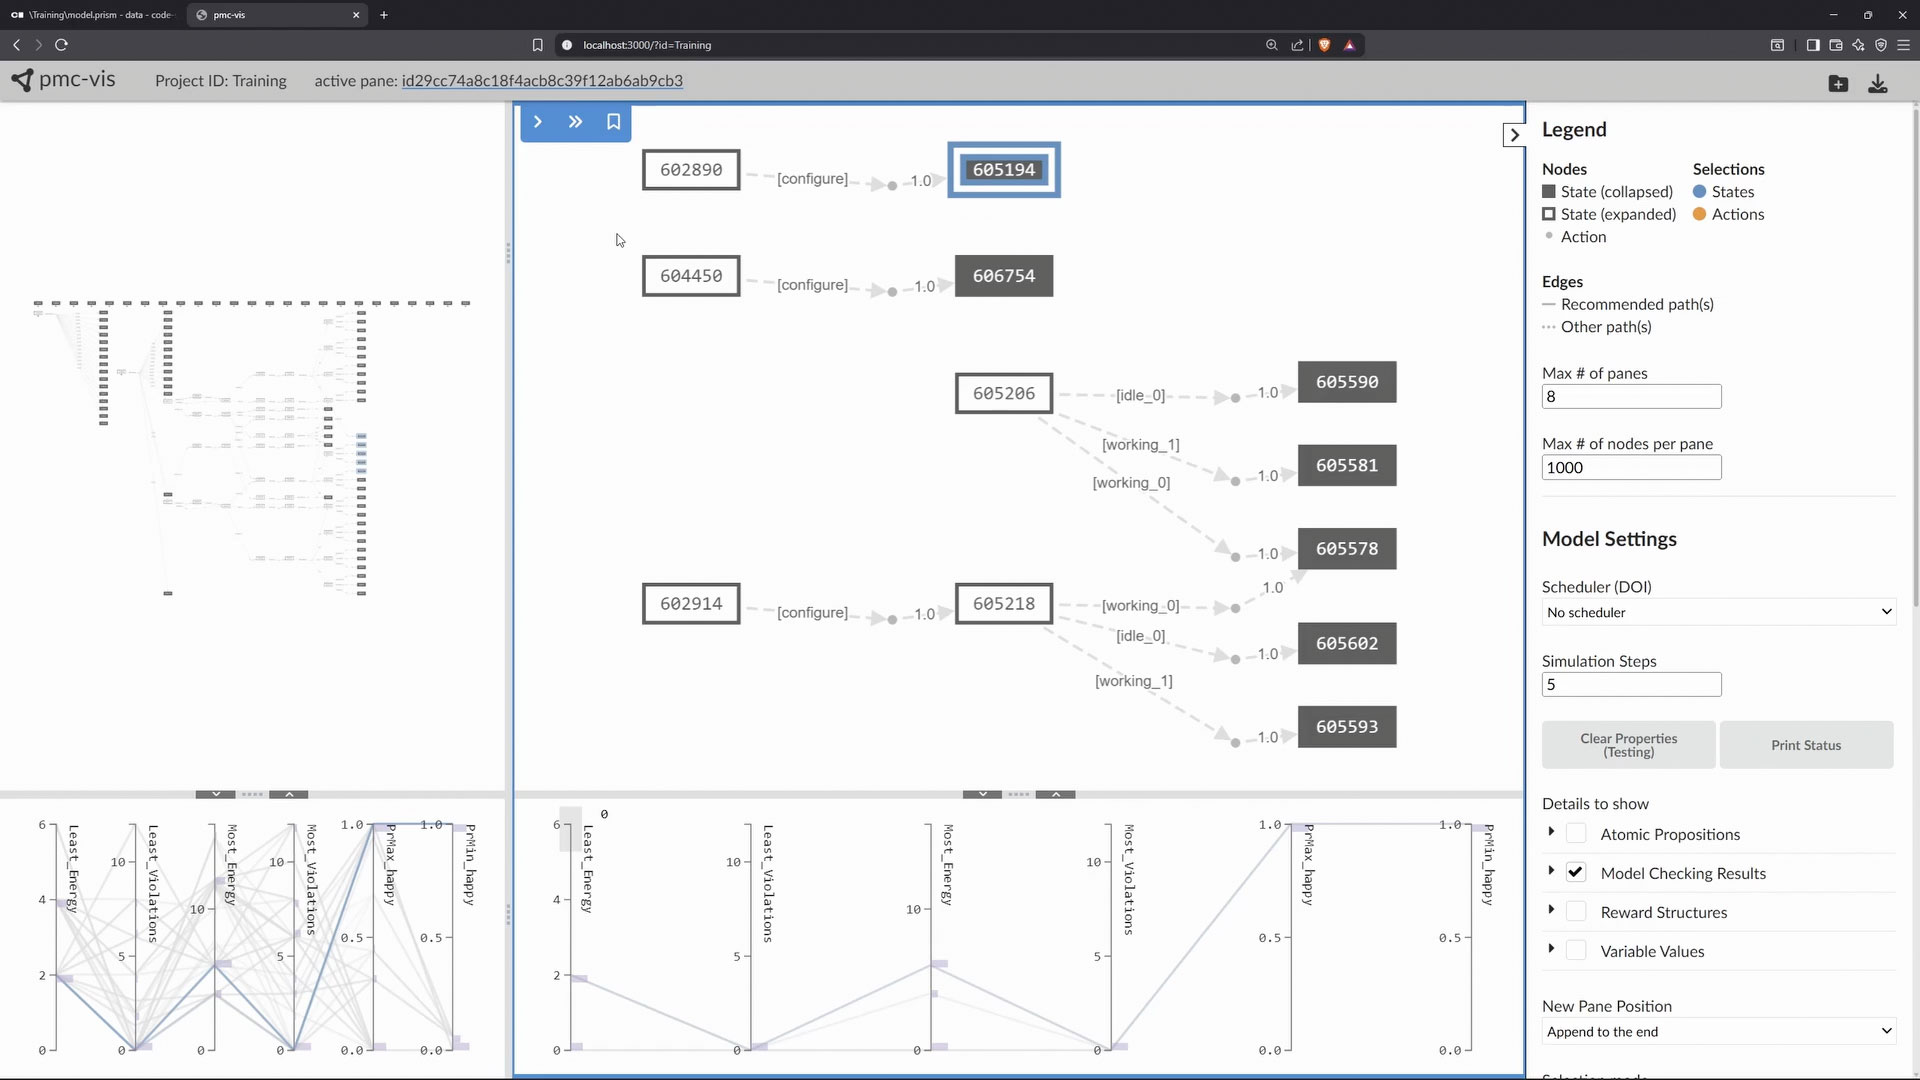
pmc-vis as a web-based visualization tool for probabilistic models that supports the exploration of large multivariate decision graphs, formal verification, and debugging.
Publication
@inproceedings{pmc-vis-2023,
author = {Max Korn and Juli\'{a}n M\'{e}ndez and Sascha Kl\"{u}ppelholz and Ricardo Langner and Christel Baier and Raimund Dachselt},
title = {PMC-VIS: An Interactive Visualization Tool for Probabilistic Model Checking},
booktitle = {Software Engineering and Formal Methods},
series = {Lecture Notes in Computer Science},
volume = {14323},
year = {2023},
month = {11},
location = {Eindhoven, Netherlands},
doi = {10.1007/978-3-031-47115-5_20},
publisher = {Springer}
}List of additional material
Prototype: Run the Application
Our tool pmc-vis is free and open source.
- Latest version:
GitHub repository with source code and Docker Compose application: https://github.com/imldresden/pmc-vis - Nov 2023 version:
DOI to the reproducibility package in Zenodo is 10.5281/zenodo.8172531; this package includes the docker images, experiments, source code and instructions on how to replicate our results.
On this page
Videos: Tool Walkthrough
Previous Versions of pmc-vis (Nov 2023)
With a previous version of pmc-vis, we also prepared videos illustrating usage scenarios.
Scenario 1: Intro to the Server Management System + Finding good initial configurations
Scenario 2: Understanding the model behavior by finding patterns
Scenario 3: Reconfiguration and schedulers
Related Student Theses

Concepts for Progressive Large Multivariate Graph Comparison
Vinzenz Fuhrmann September 4th, 2025 until February 5th, 2026
Supervision: Julián Méndez, Raimund Dachselt

Concepts for Linking Partial Degree-of-Interest Graphs for Large, Multivariate Graph Visualization and Exploration
Clarisa Sanjaya October 16th, 2023 until April 1st, 2024
Supervision: Julián Méndez, Raimund Dachselt

Design Concepts for Pathfinding and Cycle Avoidance during Exploration of Large Multivariate Graphs
Philipp McAllister January 31st, 2025 until April 17th, 2025
Supervision: Julián Méndez, Raimund Dachselt

Developing concepts for visual, interactive, and scalable graph comparison
Lea Meding May 1st, 2023 until October 2nd, 2023
Supervision: Julián Méndez, Raimund Dachselt
Acknowledgements
This work was supported by the Deutsche Forschungsgemeinschaft (DFG, German Research Foundation) under Germany’s Excellence Strategy: EXC-2068, 390729961 – Cluster of Excellence “Physics of Life” and EXC 2050/1, 390696704 – Cluster of Excellence “Centre for Tactile Internet” (CeTI) of TU Dresden, by DFG grant 389792660 as part of TRR 248 – CPEC (see https://cpec.science) and by the Federal Ministry of Research, Technology and Space (BMFTR, SCADS22B) and Saxon State Ministry for Science, Culture and Tourism (SMWK) by funding the competence center for Big Data and AI “ScaDS.AI Dresden/Leipzig”.